
Sometimes, it’s easier to understand the broader stock market by answering some (not so) hypothetical questions rather than covering a single topic in detail. And this week, that’s our exact goal – so, without further ado, here are a few such questions.
Question #1: There are countless stories of people that have been laid off recently, but there are just as many news reports that unemployment is low, which is hard to reconcile. How do you actually measure unemployment?
The Bureau of Labor Statistics (BLS), which produces the flagship jobs report, has many measures. There is the U-3 unemployment rate – the headline rate – which is the percentage of people in the labor force who are out of work. And five others, culminating in the broad U-6 rate, which is the percentage of those out of work, working part-time for economic reasons or only marginally attached to the labor force.
The unemployment rates come from the BLS’s survey of households. By contrast, job gains and losses come from the companion establishment survey, where businesses report the number of jobs they added or subtracted from payrolls. These numbers, added together, form the monthly change in nonfarm payrolls – which you see in headlines as the number of jobs added (or lost, as the case may be). Often, and confusingly, these two gauges may tell different stories.
But the question interestingly highlights something often overlooked in this figure: It tallies the net gain or loss in payrolls. Layoffs in one company, industry, state, town, etc. get offset by hirings in other companies, industries, states, towns and the like.
So, if one industry is shedding workers but another is adding them, a lot of that activity offsets.
Reporting it this way – like all statistics – brings some tradeoffs. It gives a nice snapshot of broad national trends and helps people see through the noise. But it can also gloss over other shifts, making it important to look at industry-specific data for more granular information.
To weigh layoffs against hiring, the BLS’s Job Openings and Labor Turnover Survey (JOLTS) is a good option. It shows hires, layoffs, quits and openings on a national level and by region and industry. Like the Employment Situation Report, it is backward-looking, but it can help put headlines and anecdotal evidence into context.
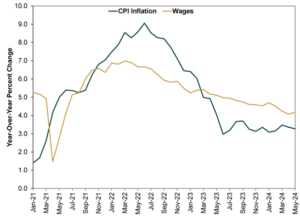
Question #2: How bad is inflation compared to wages?
A simple question with an answer that could take 10,000 words. So, instead, we will give you a picture.
As Exhibit 1 shows, wage growth tends to echo inflation. Consumer prices move first, then businesses adjust wages and salaries to compensate. If your pay changes annually, it probably does so in relation to changes in living costs (and your company’s operating costs and revenues, which determine how much it can afford to raise your pay) over the past year.
This time around was no different.
Wage growth accelerated after inflation accelerated. No doubt frustrating many, its growth rate didn’t get as high as the inflation rate. However, while it has slowed, it has exceeded the inflation rate since March 2023. So, for the past year-plus, overall and on average, workers have been regaining lost ground.
But how do wages and inflation compare over this whole miserable inflationary stretch?
Since the end of 2020, headline consumer prices are up 20.6% and wages are up 19.2%. That is getting pretty close! But for a lot of households, it probably doesn’t feel close – CPI isn’t a cost-of-living index.
An individual household’s costs won’t match the inflation basket. Your personal living costs may have risen more than one-fifth since 2020. And for wages, these are broad averages. Your personal pay may have risen more or less than 19%.
The real story here is that society, overall, has swallowed the inflation spike and is getting on with things. In our view, this is a big part of what markets have been pricing in since late-2022.
Question #3: What do folks mean when they say inflation has “lowered”, since prices are still high?
Indeed, they are. Inflation is a rate of change. A growth rate. Movement in the level of prices. When the inflation rate rises, it means prices are growing faster. When it falls, if the rate itself remains positive, it means prices are rising at a slower rate. Only when the inflation rate is negative are prices actually falling. This, in economic terms, is deflation.
Look back to Exhibit 1, and you will see the headline inflation rate is down from its high, 9.1% year-over-year in June 2022, to 3.3% last month. This is much closer to the historical average inflation rate, which has always been a side effect of money supply and economic growth. But like we said, even with the slowdown in rates, prices are up just over 20% since the end of 2020 – and they are still up 6.0%, cumulatively, since inflation peaked.
That is the bad news. The good news is inflation inflates more than just prices. It also typically inflates wages at a lag, as we just showed. And it tends to inflate corporate revenues, which helps sustain profit margins and earnings—which, in turn, helps stocks overcome inflation. Yes, inflation fears contributed to 2022’s bear market, along with a host of other worries that whacked sentiment. But stocks recovered quickly and are back to clocking all-time highs despite elevated prices.